
Reef water-test log: a printable template that actually catches trends
The single biggest difference between reef keepers whose tanks thrive for years and those whose tanks slowly decline is one habit: logging. The keepers who write down their numbers catch a calcium drift before the stony corals stop growing. They notice an alkalinity swing before it crashes the SPS. They see a nitrate climb before the algae bloom.
This is the log template I give every reef-keeping client, and the rationale behind each parameter and frequency.
The parameters, organised by frequency
A reef tank test log has three layers, organised by how often the parameter changes meaningfully.
Daily observations (no test, just look)
These don't require a kit, just your eyes:
- Pump flow — are return pump and powerheads running normally? Reduced flow often signals a clogged impeller or air lock
- Skimmer production — is the skimmer cup overflowing, underproducing, or producing wet vs dry skimmate?
- Animal behaviour — corals polyp extension, fish feeding response, any signs of stress
- Temperature — does the display read the set temperature? Sudden drops suggest heater failure; sudden rises suggest chiller failure or summer heatwave
Write these in a notebook or app daily. Takes 30 seconds. The trend detection is enormous.
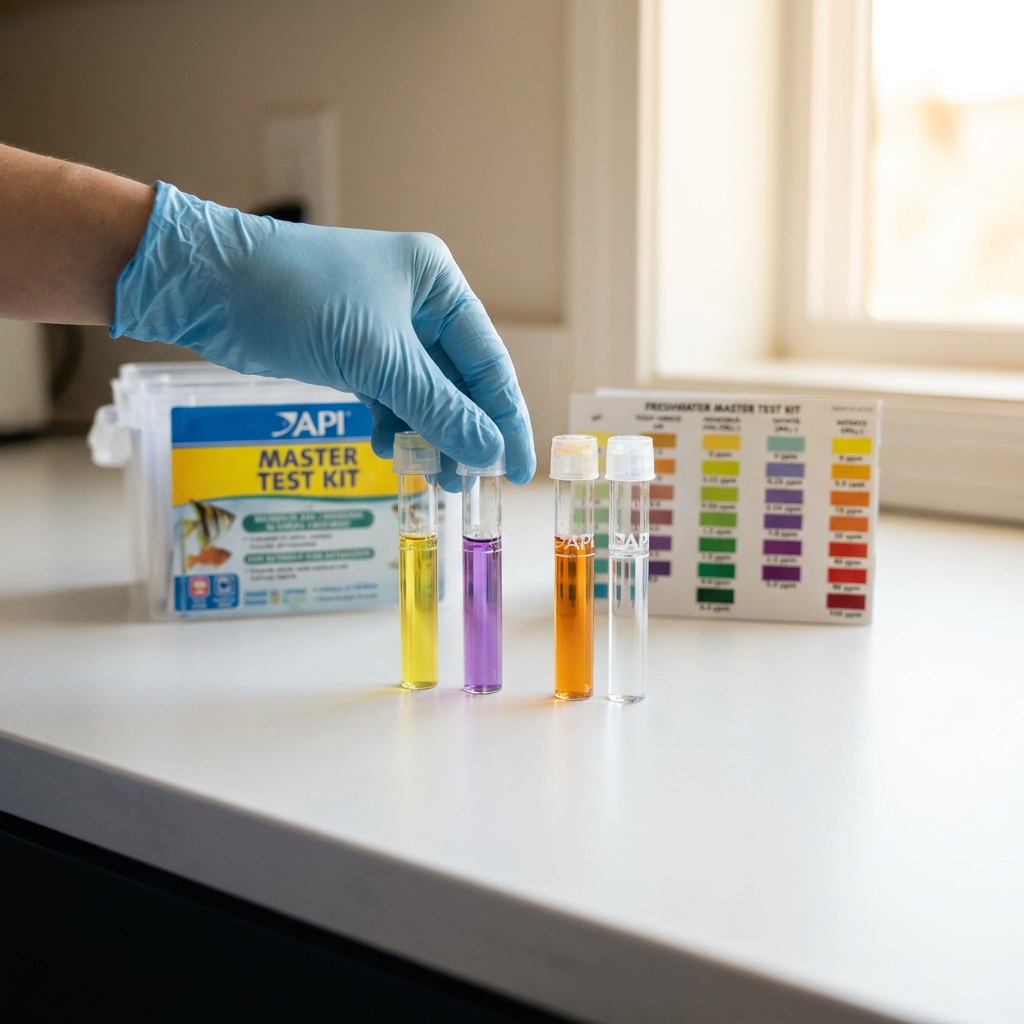
Twice-weekly (every 3–4 days)
| Parameter | Target (mixed reef) | Test kit |
|---|---|---|
| Alkalinity | 8.0–9.0 dKH | Hanna HI-772 (preferred) or Salifert |
| Calcium | 420–440 ppm | Hanna HI-758 or Salifert |
| Magnesium | 1,300–1,350 ppm | Salifert or Red Sea |
| Temperature | 25–26°C | Digital thermometer |
Alkalinity is the most important of these and the one that drifts first if your dosing system is even slightly off. Test it twice a week minimum. Calcium and magnesium drift much more slowly; twice a week catches the trend.
Weekly
| Parameter | Target | Test kit |
|---|---|---|
| Nitrate | 5–10 ppm (reef), 10–20 (FO/FOWLR) | Salifert or Red Sea |
| Phosphate | 0.02–0.05 ppm (ULNS), 0.05–0.15 (typical reef) | Hanna ULR (Ultra Low Range) |
| pH | 8.0–8.3 (lights on) | Pinpoint or Hanna |
| Salinity | 1.024–1.026 sg (35 ppt) at 25°C | Refractometer (calibrated with RO/DI at 25°C) |
Bi-weekly
| Parameter | Target | Test kit |
|---|---|---|
| Alkalinity (re-check) | Same as above | Same |
| Iodine | 0.04–0.08 ppm | Salifert |
| Strontium | 5–15 ppm | Salifert (optional) |
Most reef keepers do not need to test iodine and strontium unless they have heavy stony coral growth. Track alkalinity, calcium, magnesium, nitrate, phosphate. The rest is for advanced systems or troubleshooting.
Monthly
- Salinity calibration check — verify your refractometer with RO/DI at 25°C. Drift = replace calibration solution or the refractometer itself.
- Skimmer cup waste volume — measure and log. A change in skimmate production is often the first sign of organic load change.
- Top-off water TDS — if using RO/DI, log the TDS of the input water and the product water. Membrane replacement is needed when rejection drops below 95%.

The printable template
Here is the format I recommend — one row per test session, one column per parameter. Use a paper notebook, a spreadsheet, or an app like Reef-Pi or Apex Fusion.
+----------+--------+--------+--------+--------+--------+--------+--------+--------+--------+--------+
| Date     | Time   | Sal    | Temp   | Alk    | Ca     | Mg     | NO3    | PO4    | pH     | Notes  |
|          |        | 1.025  | 25.5°C | 8.5dKH | 430    | 1300   | 8      | 0.04   | 8.15   |        |
+----------+--------+--------+--------+--------+--------+--------+--------+--------+--------+--------+
| 2025-04-22| 08:00 | 1.025  | 25.4   | 8.6    | 432    | 1310   | 7      | 0.04   | 8.12   | Skim OK|
| 2025-04-22| 20:00 | 1.024  | 25.6   | -      | -      | -      | -      | -      | -      | Lights |
| 2025-04-25| 08:00 | 1.025  | 25.5   | 8.5    | 430    | 1300   | 9      | 0.05   | 8.14   |        |
| 2025-04-29| 08:00 | 1.025  | 25.5   | 8.4    | 428    | 1295   | 11     | 0.06   | 8.13   | Water change 10% |
+----------+--------+--------+--------+--------+--------+--------+--------+--------+--------+--------+
For paper: print a one-month log sheet, 30 rows × 11 columns, and stick it on a clipboard near the tank. The format I find most useful:
- Date and time of test
- Salinity (refractometer reading, calibrated)
- Temperature (display probe)
- Alkalinity (dKH)
- Calcium (ppm)
- Magnesium (ppm)
- Nitrate (ppm)
- Phosphate (ppm)
- pH
- Notes — equipment changes, dosing changes, livestock additions, anything unusual
The chart that catches trends
Numbers in a table are hard to spot trends in. Numbers in a chart are obvious. Most reef-keepers' software (Apex, Hydros, Reef-Pi, GHL) auto-generates charts from probe data, but the manual test kit numbers don't go in automatically. Plot them.
I keep three charts visible:
- Alkalinity (dKH) over time — line chart, target band 8.0–9.0 shaded in green
- Calcium (ppm) over time — line chart, target band 420–440 shaded
- Nitrate and Phosphate — dual-axis line chart, target bands shaded
A tank with a working dosing system shows alkalinity as a roughly horizontal line oscillating within ±0.3 dKH of setpoint. A tank with a failing dosing system shows a drift — alkalinity slowly climbing or falling, or step changes after each dose. The chart makes the pattern visible at a glance.
What the trends tell you
A few specific patterns and what they usually mean:
| Pattern | Likely cause |
|---|---|
| Alkalinity slowly climbing over weeks | Dosing too much, water changes insufficient, evaporation concentration |
| Alkalinity slowly falling over weeks | Calcium/alkalinity balance off, dosing too little, macroalgae consumption, stony coral growth exceeding dose |
| Alkalinity step-change after dose, then linear drop | Dosing event visible; linear drop rate tells you demand |
| Calcium falling faster than alkalinity | Stony coral growth > alkalinity consumption; check magnesium |
| Calcium stable, alkalinity falling | Organic carbon dosing, anaerobic denitrification, kalkwasser use |
| Nitrate creeping up 1–2 ppm/week | Bioload increase, feeding increase, skimmer degrading, denitrator exhausted |
| Phosphate creeping up | GFO/PO4-remover exhausted, feeding increase, fish load increase |
| Nitrate dropping, phosphate dropping | Macroalgae growth, GFO fresh, biopellets working harder |
| Salinity drifting up over weeks | Top-off water insufficient (evaporation exceeds top-off) |
The trends are the early warning. A nitrate that creeps from 8 to 12 to 18 over six weeks is a tank heading toward an algae bloom. A nitrate that suddenly drops from 10 to 2 in three days is a tank where something died and is being processed by the bio-filter. Both warrant investigation.
Tools that make this easier
If you want to spend less time logging and more time enjoying the tank:
- Apex, Hydros, or GHL controllers — automate pH, temperature, salinity, and ORP logging. $300–800 investment but pays for itself in saved livestock within a year.
- Triton, Reef Factory, or similar ICP testing — quarterly mail-in test of 30+ trace elements. Best $50/quarter you can spend on a high-end reef.
- Reef-Pi or Apex Fusion — open-source / freemium dashboard for charts and alerts. Mobile access means you notice problems before they escalate.
- A simple spreadsheet — free, works, requires discipline.
The bottom line
A reef tank log is not optional equipment. It is the difference between a hobby you control and a hobby that surprises you with crashes every few months. The template I outlined above takes 5 minutes per session, twice a week. The chart review takes 2 minutes per week. The investment is small. The payoff is a tank that hums along for years instead of one that dies in month 18 because nobody noticed the calcium drift until the corals stopped growing.
---
About the author: [Olivia Brown](../Olivia%20Brown.md) is a marine biologist (PhD, University of Miami) with 10 years of marine aquarium practice, and consults for several U.S. saltwater aquarium brands on system design and livestock care.